Gain an Unfair Edge: A Deep Dive into Flowly Indicators for TradingView
Most traders spend their days staring at candlesticks, trying to decipher price action based on nothing more than visual patterns. But the real story behind every market move isn't written in the candle’s shadow—it’s hidden deep within the orderflow. If you’ve ever felt like the market is playing a game you aren't privy to, you’re likely missing the data that smart money uses to navigate the chaos.
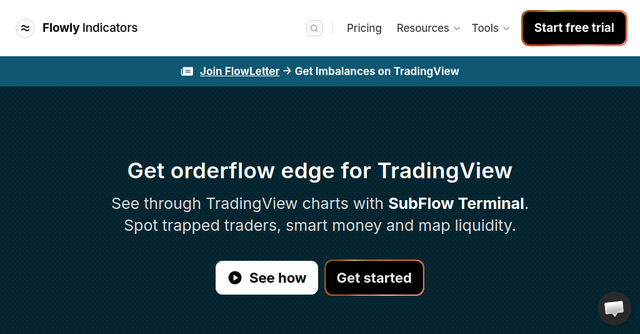
This is where Flowly Indicators comes in. As an indie-built SaaS solution designed specifically for the TradingView ecosystem, it provides the kind of granular market intelligence usually reserved for institutional trading desks. Whether you’re a crypto enthusiast or a stock market day trader, Flowly adds an "X-ray" layer to your charts, helping you spot trapped traders, liquidity pools, and institutional volume before they turn into major price moves.
What Exactly is Flowly Indicators?
Flowly Indicators (also known as the SubFlow Terminal) is a powerful, minimal SaaS tool that integrates directly into your existing TradingView setup. Unlike external platforms that require complex API connections or clunky software installs, Flowly works right where you already do your analysis.
The tool is rooted in Auction Market Theory, providing a professional-grade suite of orderflow analytics that function across all markets and timeframes. It’s built for traders who are tired of guessing and want to move toward data-driven decision-making. With over 3,200 users already leveraging the tool on TradingView, it has quickly become a standout in the indie developer space for its blend of deep functionality and clean, aesthetic design.
Why Orderflow Matters for Your Trading Strategy
In modern markets, volume isn't just a bar at the bottom of your screen. It’s the fuel that drives price. When you use standard indicators, you’re looking at the result of the trade. When you use Flowly, you’re looking at the intent behind the trade.
By understanding where large orders are being placed and where liquidations are triggering, you can effectively anticipate where the "path of least resistance" lies. This is the difference between reacting to a breakout and being positioned before it happens.
Key Features That Change the Game
Flowly provides a robust feature set that turns your TradingView charts into a high-powered terminal. Here’s why these specific tools matter:
1. Liquidity Heatmaps
Liquidity is the magnet of the market. Large institutional players need deep pockets of liquidity to fill their massive orders without causing too much slippage. Flowly’s Liquidity Heatmap allows you to visualize these deep zones, showing you exactly where traders are likely setting large buy and sell orders. By spotting these areas, you can identify where price is likely to be pulled—and where it might get swept.
2. Internal Flow (The X-Ray View)
Ever wonder what happened inside a single candle? The Internal Flow feature acts like an X-ray, allowing you to see through the candle to detect aggressive, high-value orders that are hidden from the naked eye. This is essential for identifying conviction moves by smart money versus simple retail noise.
3. Liquidations
There is nothing quite as profitable as a "liquidation cascade." When a large group of traders gets "rekt" (their stop-losses are triggered), they are forced to puke their positions, which in turn fuels the price in the opposite direction. Flowly Indicators helps you identify these moments of exhaustion, allowing you to catch the reversal when the market is most liquid.
4. Value Area & Point of Control (POC)
Understanding where the majority of trades occurred is vital for gauging market sentiment. The Value Area and POC tools show you the "pinnacle of interest" for a given period. If price is trading outside of the value area, you know the market is in discovery mode; if it’s inside, it’s in balance. Following these flows helps you stay on the right side of the trend.
Automation for the Modern Trader: Scans and Alerts
One of the biggest pain points in trading is the need to sit in front of a screen for hours. Flowly addresses this with powerful automation features:
- Market Scans: Instead of manually flipping through hundreds of charts, you can use Flowly to scan the entire market at once for specific volume events. This saves massive amounts of time and ensures you never miss a high-conviction setup.
- Custom Alerts: You can build custom alerts based on multiple conditions. Whether it’s an unusual volume spike or a specific liquidity sweep, you can set the criteria and get notified exactly when the flows are turning.
Practical Use Cases: Putting Flowly to Work
How does this look in a real-world scenario? Here are a few ways you can integrate Flowly into your workflow:
- Spotting Trapped Traders: When you see a massive spike in volume that fails to move the price in the direction of that volume, you’ve likely found trapped traders who are about to be squeezed. Flowly makes these moments visible as they happen.
- Riding Breakouts: Use the liquidity pools to identify imminent breakouts. When price clears a significant liquidity level, it often accelerates. Joining this flow with the help of Flowly’s real-time data allows you to ride the momentum rather than fighting it.
- Finding "Pain" Trades: By identifying where retail traders are getting liquidated, you can effectively counter-trade the exhaustion. When the crowd is "puking" their positions, it often marks the bottom or top of a local move.
Why Indie-Built SaaS is the Future of Trading Tools
There’s a unique advantage to using tools built by indie developers like the team behind Flowly. Unlike massive, bloated legacy platforms, Flowly Indicators is built with a "minimal but powerful" philosophy. It’s designed to do one thing—provide superior orderflow data—and it does it exceptionally well without the clutter that slows down your trading platform.
The community support speaks for itself. With glowing feedback from users who appreciate the "X-ray" capabilities and the aesthetic, clean implementation, it’s clear that this tool is built by someone who actually trades.
Getting Started
If you’re ready to stop guessing and start trading with an edge, it’s time to upgrade your charts. Flowly is designed to be plug-and-play, meaning you can get up and running on your existing TradingView setup in minutes. You don't need to be a coding genius or a data scientist; the tool handles the complex math, leaving you to focus on executing your strategy.
Stop looking at the surface of the market and start seeing what’s happening underneath.
Visit Flowly Indicators today to unlock your orderflow edge and start trading with confidence.